The Pandemic and the Insurance Market: A Data-Based Analysis
Determining the impact of the pandemic, whether on the business itself or on the market as a whole, is a common issue among companies, irrespective of size or industry.
To find the answers for the insurance market, we need not tables and graphs, but a detailed breakdown of information to capture certain movements caused by changes in insurance consumption patterns; these are data that are seldom discussed by insurers.
The pandemic and the economic landscape suddenly changed people’s and businesses’ needs in terms of protecting assets and capital, and we set out on a search for answers by looking at revenue volumes, spending, product margins, and financial results for the industry. Let’s get to it, then. First, an insurer’s main barometer is its source of revenue: its premiums. In general, considering the insurance market except Personal Injuries Caused by Land-based Automotive Vehicles (known as DPVAT in Brazil), the market held the line in comparison with production from the same four-month period from the previous year, with BRL 35 billion’s (USD 6.66 billion) worth of policies issued.
However, the total value of premiums for policies issued masks the effects caused by COVID-19 and the effects of lockdowns, such as an increase in unemployment and the shuttering of restaurants and retail shops. To better understand these numbers, we need to drill down into the total value of premiums per insurance category, and then per year, in order to break out the changes that arose between 2019 and 2020. Looking at the information below, it is interesting to note that 79% of the premiums issued were concentrated in three categories: automobile, persons, and assets.

The total value of premiums for policies issued masks the effects caused by COVID-19 and the effects of lockdowns, such as an increase in unemployment and the shuttering of restaurants and retail shops.
Still in the category-based analysis, we compared four-month periods and verified drops of 9% and 6% in the issuance of financial risk and auto/transport policies. In financial risk, this decline was concentrated in purchases of Public-Sector Guarantee with a 25% drop in issuance, but this was partially offset by an increase in volume in Landlord Insurance (+42%) and Private-Sector Guarantee (+58%). It’s important to look at the reasons behind these increases. With Landlord Insurance, in the event of a default on rent payments, insured landlords are guaranteed payment by the insurer for the contingencies listed under their policy that, in adverse situations such as unemployment, gives rise to the claims payment. On the other hand, the increase in internal demand for Judicial Guarantee Insurance has driven the financial risk category, for cases where companies would seek to recover the deposit in court to ensure their cash flow.
Emptier streets, with restrictions that include public-health-based checkstops in a few municipalities, have a direct correlation with the auto and transportation categories. Policyholders end up questioning the need to keep paying for coverage and opt to reduce it or even cancel it in order to reduce fixed costs, especially if their revenue has been affected. This trend has been causing an increase in interest in on-demand auto insurance, and insurers now have the challenge of providing continuous, prompt functionality, with the same coverage as in traditional insurance, to serve their clients and keep them happy.

In the Transportation category, there is high demand for essential activities, but total traffic has been partially reduced. E-commerce has not stopped and it is a current trend, but it doesn’t compare to pre-pandemic volume. The increase in demand for digital functions and secure storage of banking or confidential information also opens up possibilities for new types of insurance, in line with the General Data Protection Act (LGPD in Portuguese).
While these three categories are on the decline, credit or liability coverage is on the rise, is are the case with Residential insurance and D&O and E&O. For liability insurance, one of the objectives is protection for executives involved in lawsuits filed against them as a result of actions by their management that caused involuntary monetary damage, personal injury, or pain and suffering to third parties. While Residential rose by 6%, liability increased even more, at 19%. Interest in productivity protection, such as Farm insurance, also grew, with an increase of 35% when comparing four-month periods.
In terms of claims, we used the claims ratio (claims/earned premium) to characterize the level of commitment of the revenue effectively earned just from settlements. The market’s overall claims rate did not change on average, but it should be noted that the level of economic activity and priorities have. Right now, many people are focusing their attention less on assets, and more on their health and wellness. In other words, there may in fact be a pent-up demand for some types of insurance coverage.
Despite the unchanged average, a few segments were more heavily impacted directly by the pandemic, overseas healthcare costs in travel insurance, loss of profit, and problems in the movement of cargo. Here are the claims rates for 2019 and 2020, over the same four-month periods.
- Group travel insurance: 30% [2019] to 149% [2020]
- Individual travel insurance: 71% [2019] to 100% [2020]
- Loss of profit: 87% [2019] to 156% [2020]
- International transport: 55% [2019] to 109% [2020]
- Rail transportation: 73% [2019] to 105% [2020]
As expected, health risks in travel insurance increased due to the health crisis. And, crises in production have led to additional purchases of loss-of-profit policies.
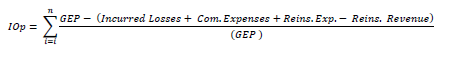
Let’s look now at an analysis of margin per product, using an index defined here as the Operational Index (IOp). This indicator aims at describing the “leftover” (margin before administration expenses) of a given company and/or line of business. From the Earned Premium, we deduct the Expenses Incurred (Claims Made, Commercialization Expenses + Reinsurance Expenses), and consider the Recovery of Claims from Reinsurance, arriving at the following expression:
As expected, health risks in travel insurance increased due to the health crisis. And, crises in production have led to additional purchases of loss-of-profit policies.
Let’s look now at an analysis of margin per product, using an index defined here as the Operational Index (IOp). This indicator aims at describing the “leftover” (margin before administration expenses) of a given company and/or line of business. From the Earned Premium, we deduct the Expenses Incurred (Claims Made, Commercialization Expenses + Reinsurance Expenses), and consider the Recovery of Claims from Reinsurance, arriving at the following expression:
Where:
- GEP: Earned Premium for Insurance = Premiums Issued + RVNE Premium +- PPNG Var. / PPNG RNVE;
- Incurred Losses: Claim Filed = Notified Settlements + Expenses Related to Claims + Assistance Services + Salvage and Reimbursements +- Var. in Expectation for Salvage and Reimbursements +- Variance in IBNR/ER;
- Commercial Expenses: Commercial Expenses = Brokerage + Agency Fees + Management Fees + Other Acquisition Costs;
- Reinsurance Expenses: Reinsurance Expenses = Reinsurance Premiums’ (-) ‘Variance in Reinsurance Assets PPNG/PCC-PPNG/Other;
- Reinsurance Revenue: Reinsurance Revenue = ‘Reinsurance’ (+) ‘Expenses’ (-) ‘Salvage & Reimbursements’ (+) ‘Variance in IBNR Reinsurance Assets’ (+) ‘Variance in PDR Reinsurance Assets – IBNR Portion’ (+) ‘Variance in Reinsurance Assets from the IBNER Adjustment for the PSL’ (-) ‘Variance in Reinsurance Assets from the Adjustment for Salvage & Reimbursements for the PSL’ (-) ‘Reduction to Recoverable Amount’;
Looking at this indicator, it can be seen that there was no significant change in average margin. The interpretation here is that there was no increase in payouts, business spending, or cost of reinsurance, and that the revenue from earned premium remained stable over the period.

Looking at it from a slightly different perspective, excellent margins can be seen in Group (34%) and Residential (66%) products, indicating that these lines have “good operational margins” to be able to tolerate any future increase in claims.
In terms of insurers’ profitability, there was a 21% drop in total earnings when compared with 2019. From January to April 2020, there may have been an increase in labor-related expenses when wages were advanced to pay for vacation when employees went to working from home (on a case-by-case basis) and for the performance in asset management (financial result), where a few insurers have a greater dependence on their fiscal-year results. In the figure below, we can see the total earnings for the market of BRL 6.51 billion (USD 1.25 billion) in 2020, vs. BRL 8.29 billion (USD 1.59 billion) in the first four months of 2019.

”The insurance market withstood the effects of COVID-19, but the client consumption profile has completely changed, and this will have an even bigger effect on whether existing products are maintained or new products are developed”
In short, the insurance market withstood the effects of COVID-19, but the client consumption profile has completely changed, and this will have an even bigger effect on whether existing products are maintained or new products are developed. There was no increase in the overall claims rate for settlements that were paid out or not up to April, but we will need to quantify risks as soon as the indicators are available. The total product margin for the year seems not to have been negatively affected, which is an indication of quality in the pricing of risks and management of spending in a few companies. This may be good news for some but it requires some attention; therefore, this is a time for corporate transformation and for caution in order to not get caught out by the risks.
Virlei Laranja is the Actuarial and Business Intelligence Coordinator for Austral Seguradora.